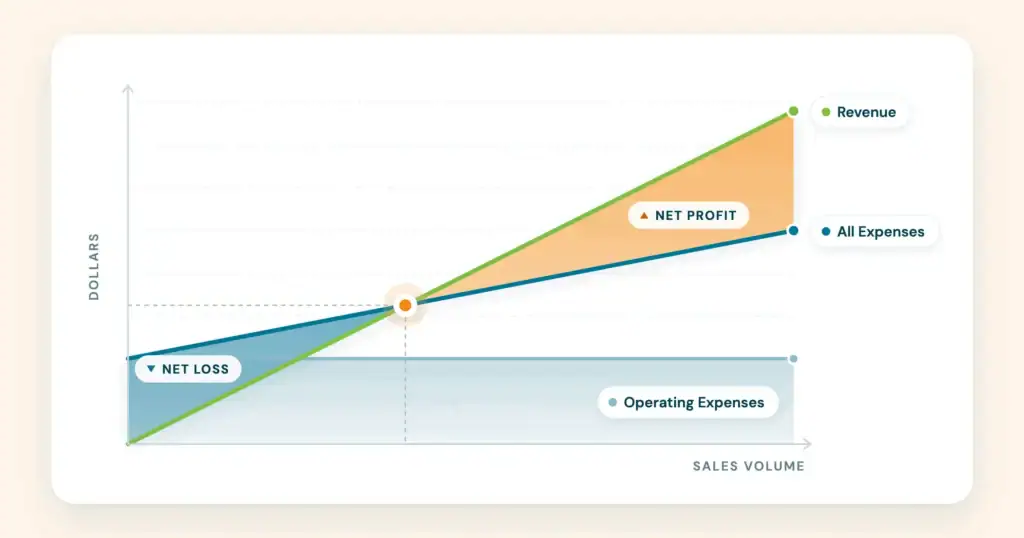
You’re reviewing your latest profit and loss statement with your financial team. Your business brought in $500,000 in revenue last year, and after every expense was paid, $50,000 was left. That means you kept 10 cents of every dollar, or 10%.
That percentage is your net profit margin. Gross and net profit margin tell you how much of your revenue remains after different costs. Gross margin looks at direct costs, while net profit margin accounts for all expenses.
Is 10% a good result? It’s a question I hear from business owners all the time. By the end of this guide, you’ll be able to calculate your own gross and net margins and figure out what a good margin looks like for you.
What Your Margins Actually Measure
When comparing gross margin vs net margin, you can calculate the numbers for both based on your profit and loss statement (P&L).
Gross profit margin shows how much revenue remains after the direct costs of delivering your products or services. These costs of goods sold (COGS), can include materials, subcontractors, and direct labor. It can also help you evaluate your pricing. If the cost of delivering a service increases but your prices stay the same, you’ll keep less of each sale.
Net profit margin shows how much remains after all expenses, including rent, administrative payroll, insurance, and other operating costs. Note that a net margin of 0% is called your break-even point. That’s the exact amount of revenue needed to cover all expenses (direct and indirect) related to running your business, with nothing left over as profit and nothing short.
Example Margin Calculations
Say your business brings in $100,000 in revenue. For this example, let’s say $40,000 goes toward direct costs and another $45,000 toward operating expenses (assuming no additional interest, taxes, or other income). Your P&L will look something like this:
| Financial factor | Amount |
| Revenue | $100,000 |
| Direct costs | $40,000 |
| Gross profit | $60,000 |
| Other expenses | $45,000 |
| Net profit | $15,000 |
Here’s how to calculate both margins using the gross and net profit margin formulas:
- Gross profit margin = (Gross profit ÷ Revenue) × 100
- Using the example above, the gross profit margin is 60%
- Net profit margin = (Net income ÷ Revenue) × 100
- Using the example above, the net profit margin is 15%
That means you keep 60 cents of every revenue dollar after direct costs, and 15 cents after all expenses are paid.
Because margins show profit as a percentage of revenue, they make it easier to compare financial performance when revenue changes, and that’s where they really earn their keep.
Now imagine revenue increases to $120,000, but net profit stays at $15,000. Your net margin drops from 15% to 12.5%, which means you’re bringing in more money but keeping less of it.
To see which way your own margin is moving, run the net margin formula on this year’s P&L and last year’s, then compare the two percentages.
What Is a Good Profit Margin? It Depends on Your Goals
There’s no single right percentage for every business so start with your industry. For childcare centers, I often see these net ranges*:
- 0–5% profit margin: Very little room to cover unexpected expenses.
- 5–10% profit margin: Some room to cover unexpected expenses.
- 10–15% profit margin: Enough to cover surprises and set money aside for planned costs
- Above 15% profit margin: Enough to build a real cash cushion, reinvest in the center, and ride out a slow enrollment season
*These reflect my experience with childcare finances, not universal benchmarks.
Then consider your financial and personal goals. Maybe you want to spend less time managing daily operations. Hiring a director would increase your expenses and could lower your profit margin, but it would also give you some of your time back. Or maybe you don’t mind managing the daily operations, in which case keeping that role yourself keeps expenses down and earns you a higher margin in exchange for your time.
Neither approach is automatically better.
Every year, I set margin goals for Harmoney and compare them with the previous year’s results. Sometimes the question is just, “Are we closer to our margin goals than we were last year?”
What a Healthy Margin Buys You
Say a teacher calls out sick on a Tuesday. You need someone to cover their shift and keep the classroom properly staffed, but how does that additional expense affect your budget?
Your margin. It’s the money left over after every regular expense is paid, and it’s what covers the costs nobody put on the calendar.
It also pays for the costs you do plan. I recently spoke with a childcare owner who had expanded from a license for 39 children to one for 72. Growing that much means more staff, more classroom expenses, and more financial decisions to make. A healthy margin made the expansion possible, giving the center room to grow while still covering unexpected costs and building savings.
Profit on paper doesn’t always mean cash in the bank, though. Before you commit to a big move like an expansion, compare your bank balance against the bills coming due over the next few months, so the timing works for your cash flow.
What Your Margins Show You That Profit Alone Doesn’t
I’ve seen a business improve its margins by dropping one underperforming service out of four revenue streams. But cutting a service isn’t always the answer. Adjusting prices or reducing costs might make more sense once you factor in shared expenses.
Your chart of accounts should make it easy to see what each service brings in and what it costs to deliver.
At Harmoney, our account managers track profit margins month over month and year over year. We look at what’s driving any significant changes and whether the results match the owner’s expectations.
Did supplier costs increase? Did payroll change? Have credit card processing fees or subscription costs increased?
A budget also gives you something to compare against. You can see where actual costs differ from what you expected. Reviewing these changes during a mid-year financial review can help you decide where to focus.
Common Mistakes That Can Skew Your Margins
One of the biggest issues I see is how expenses are categorized.
For service-based businesses, it’s easy to mix up direct costs, like labor and materials, with overhead expenses, like administrative payroll and office costs.
Recording direct costs as overhead can make your gross margin look higher than it actually is, even if your net profit stays the same.
A well-categorized chart of accounts keeps your margins accurate, so you can have a true picture of profit. If your chart of accounts needs a rework, contact us.
Another mistake worth mentioning is that software subscriptions, processing fees, and other recurring costs can gradually increase without attracting much attention. This is one example of expense creep, and it can directly affect your margins.
What Should You Compare Your Margin To?
I’d start with your own numbers. How does this month’s profit margin compare with the same month last year? Are you keeping more of what you earn, or less?
It’s also worth seeing how businesses in your industry are doing. NYU Stern publishes profit margin figures by industry, which can provide context, just remember that these figures aren’t specific to small businesses in Massachusetts.
Frequently Asked Questions
Yes. If your expenses exceed your revenue, your net profit margin is negative. A business earning $100,000 with a $5,000 net loss has a -5% net margin.
Your P&L, also called an income statement, provides the revenue, gross profit, and net income figures needed to calculate your margins.
There’s no single reliable average for Massachusetts small businesses. Margins vary by industry and business model, so industry-specific comparisons are more useful.
Yes, if other income or gains exceed the expenses deducted after gross profit. Normally, net margin is lower.
Start With Last Month’s Numbers
Open last month’s P&L. Divide gross profit by revenue, then net income by revenue. Multiply each result by 100.
Write down both percentages next to the margins you’d like to reach.
If there’s a gap, look at which costs might explain the difference.
If you’d like help understanding what those numbers mean for your business, schedule a call to learn how Harmoney’s advisory services can help.